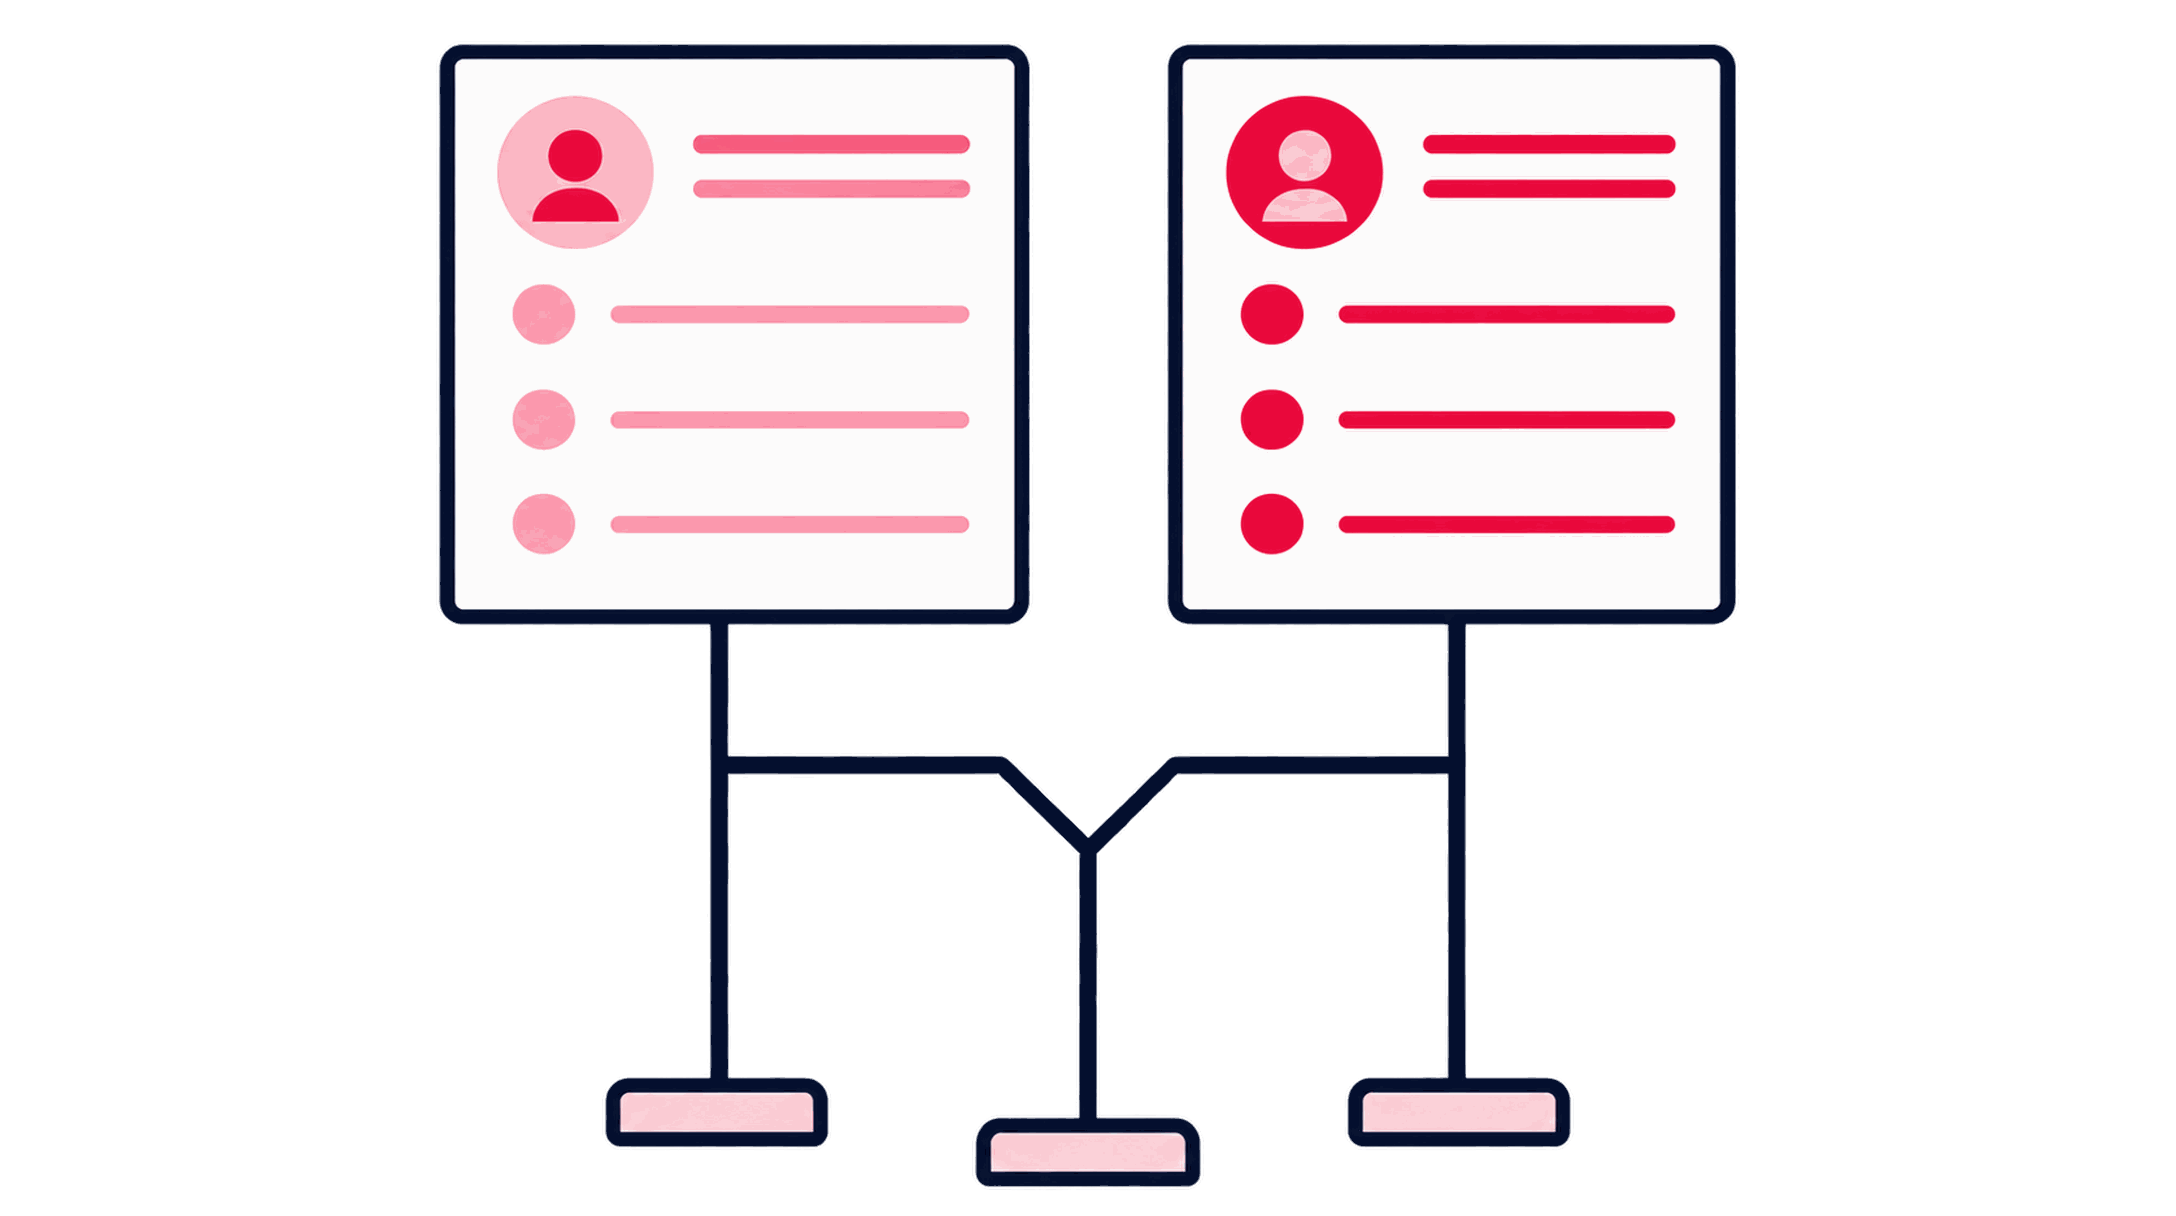







Funnel Friction & Journey Diagnostics
The step where someone leaves may not be where the underlying friction began.
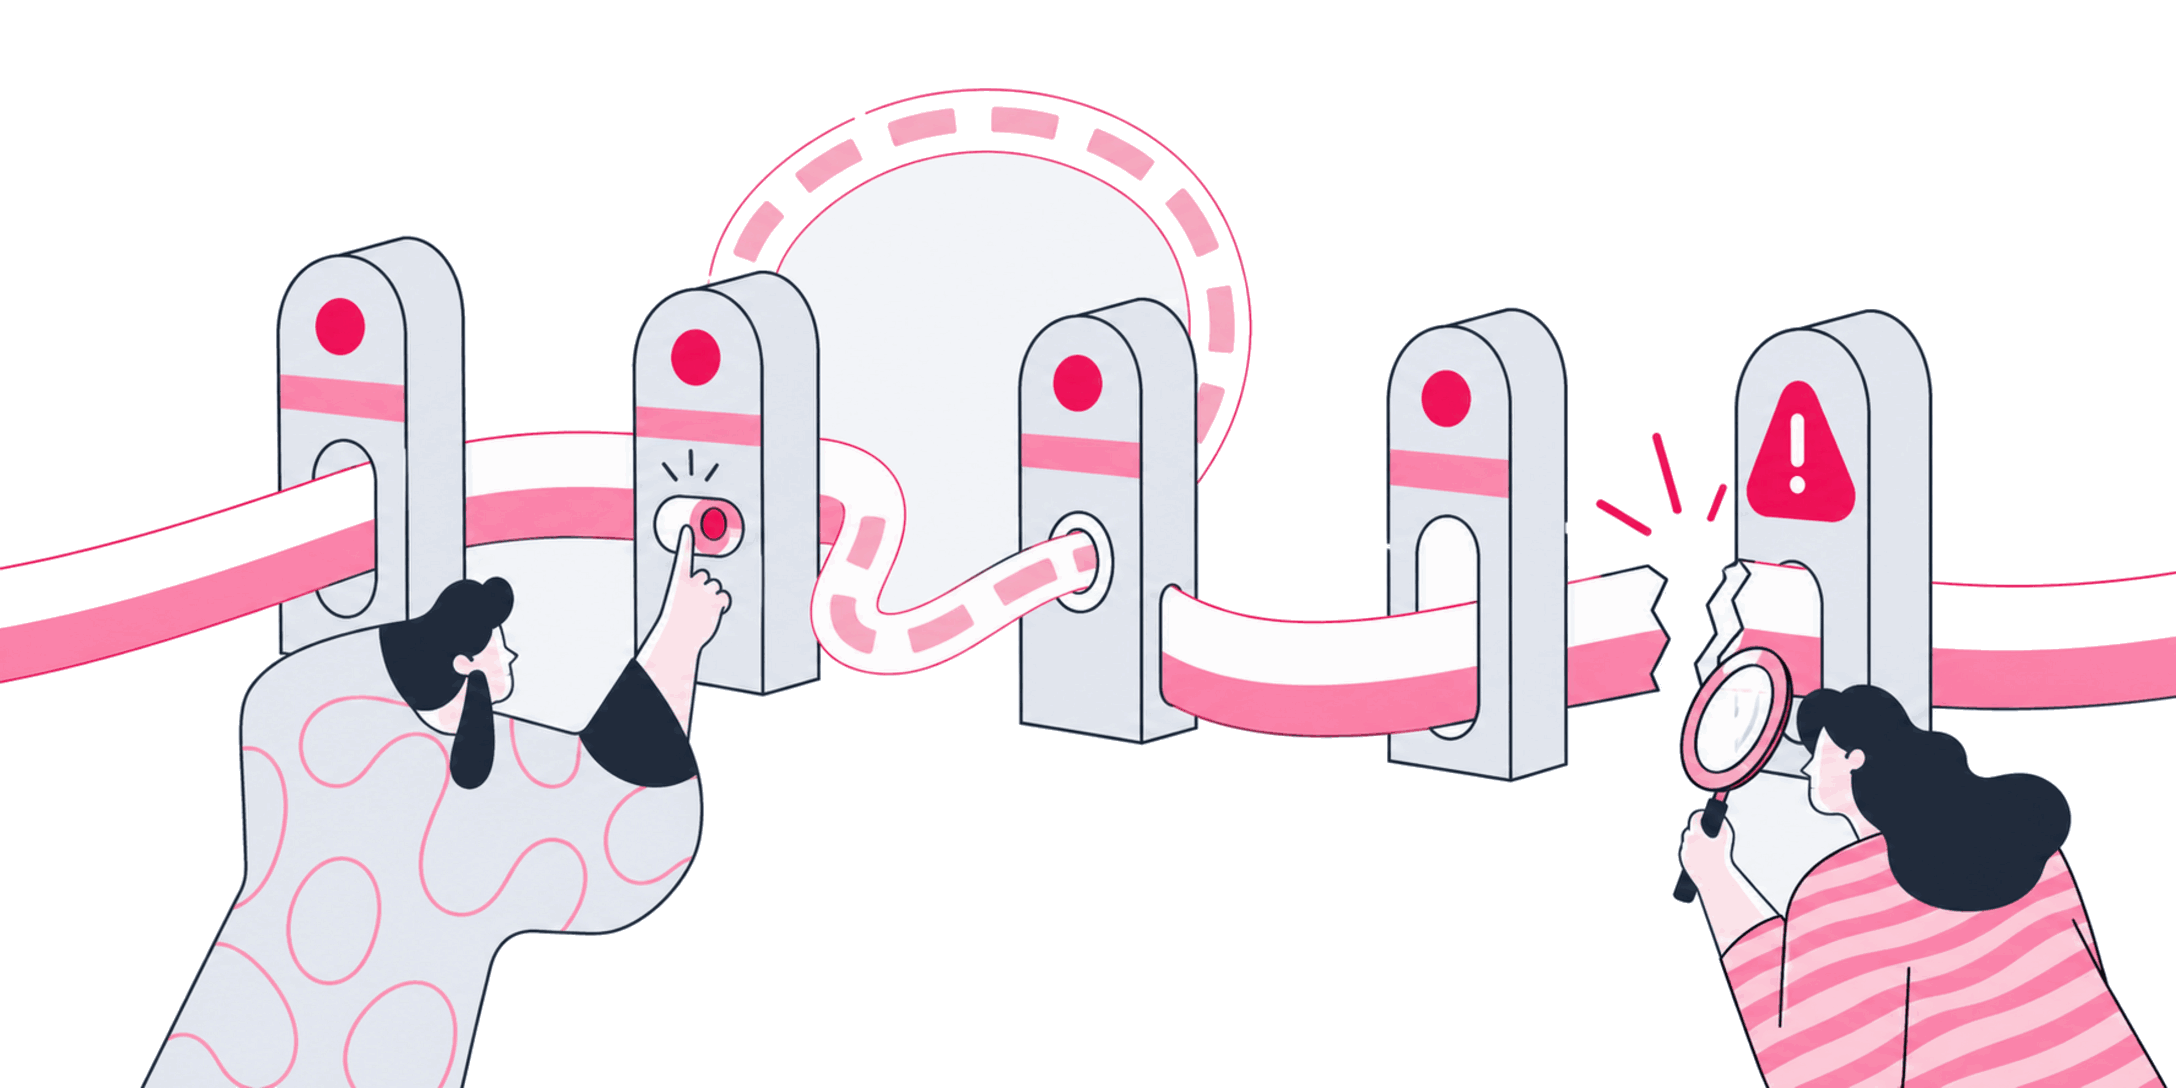
A funnel report marks the visible drop. We map the paths that led there, including backtracking and re-entry, then separate true exits from people who eventually continue. The evidence may point to friction one or two steps earlier. You get a journey-wide map of hesitation, loops, and exits, with evidence attached to the point where the likely cause sits. This diagnostic starts with a funnel drop the current report cannot explain and a suspicion that the visible step tells only part of the story.


Some of the 500+ brands we've worked with
See all references















































How the work runs
Reconstruct the path people really take
We map the branches, loops and re-entry points before deciding where the problem sits. AI can compile observed paths and flag possible links between steps. Human reviewers decide whether the evidence is strong enough to name a likely cause in the handoff.
How we hold ourselves to it
- Location and cause are separate questions
- Build the map from observed paths
- Keep backtracking and re-entry in the evidence
- Attach every observation to its step
Build the real step-to-step map
Chart observed paths through the journey, including backtracking, skipped steps, and re-entry points. Keep the idealized straight-line path as a reference for comparison. The CRO strategist confirms the map reflects real behavior before analysis continues.
Observed path map including backtracking, skipped steps and re-entry, beside the idealized path.

Rank steps by drop-off and by exit-vs-loop behavior
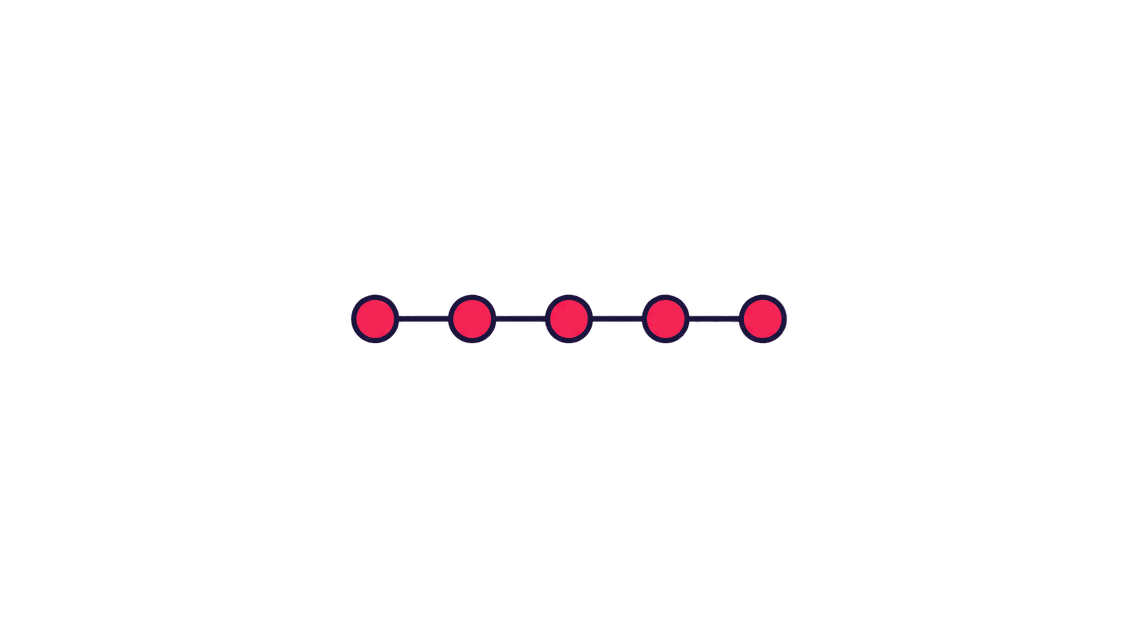
Separate steps where people truly leave from steps where they loop back and eventually continue. Those need different fixes, and conflating them wastes effort on the wrong one. The research owner confirms the classification against a sample of real sessions.
Exit-versus-loop classification per step with the counts behind each call.
Attach qualitative evidence to specific steps
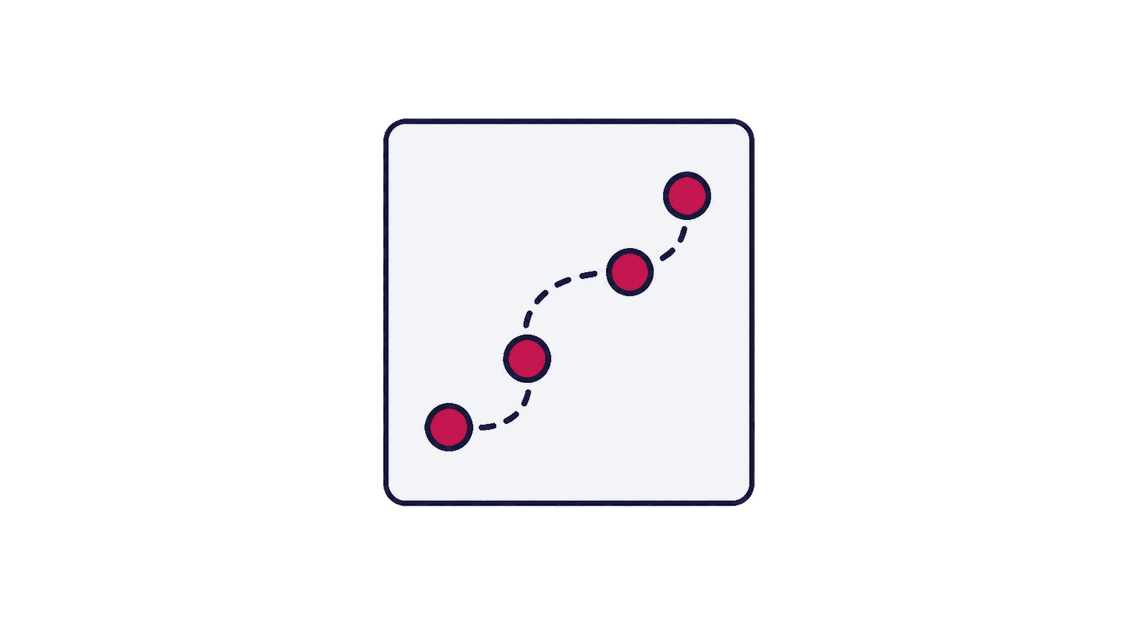
Tie exit-survey responses, support tickets, and session recordings to the exact step they describe. General journey feedback stays unassigned until the context is clear. The research owner resolves any evidence that's ambiguous about which step it belongs to.
Step-tagged qualitative evidence, with ambiguous material left unassigned.


Trace suspected downstream problems to their upstream cause
For each high-drop step, check whether the cause is local (something wrong on that step) or upstream (a promise, expectation, or confusion set one or more steps earlier). The CRO strategist confirms which flagged upstream links are worth pursuing.
Cause trace separating a local step problem from an upstream expectation problem.

Build the journey evidence map
Assemble the step-to-step map, the exit-vs-loop classification, and the attached qualitative evidence into one cross-step map ordered by opportunity size. The CRO strategist signs off on the ranking before handoff.
Cross-step evidence map ordered by opportunity size.
Hand off findings at the supported cause
Organize each finding around the step where the evidence places the likely cause. The handoff also records the downstream step where the drop became visible. The client owner reviews the handoff before it's used to plan fixes or tests.
Handoff organized at the step the evidence supports, recording where the drop became visible.
What lands with your team
The records behind the journey diagnosis
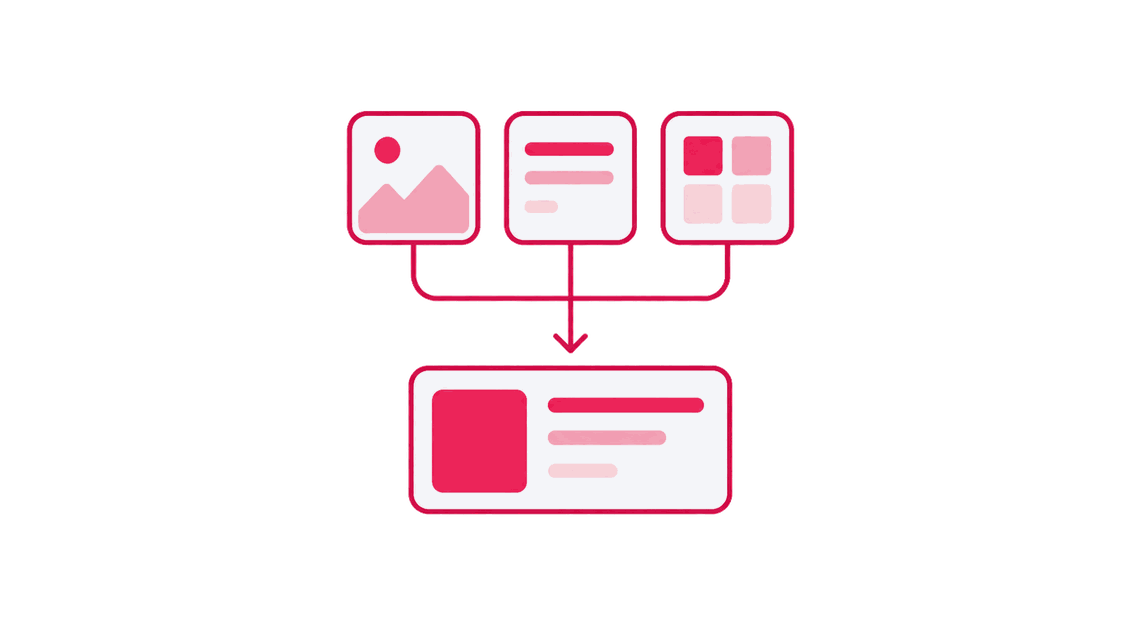
These four artifacts connect the paths people took, where they eventually left, what they said and where the evidence suggests the problem began.
Step-to-step path map
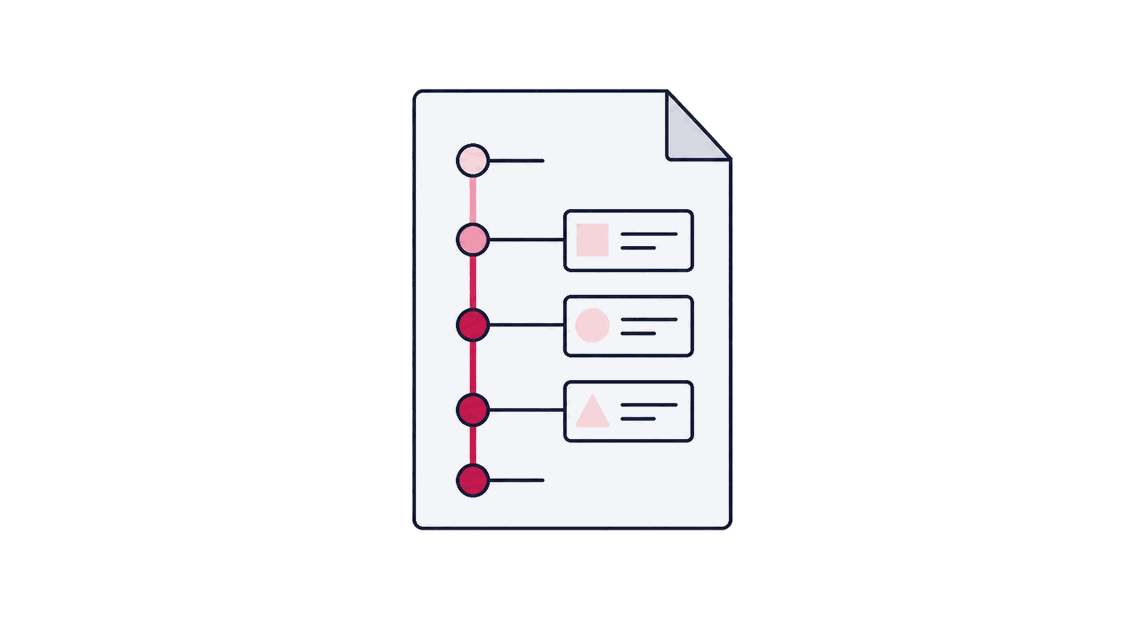
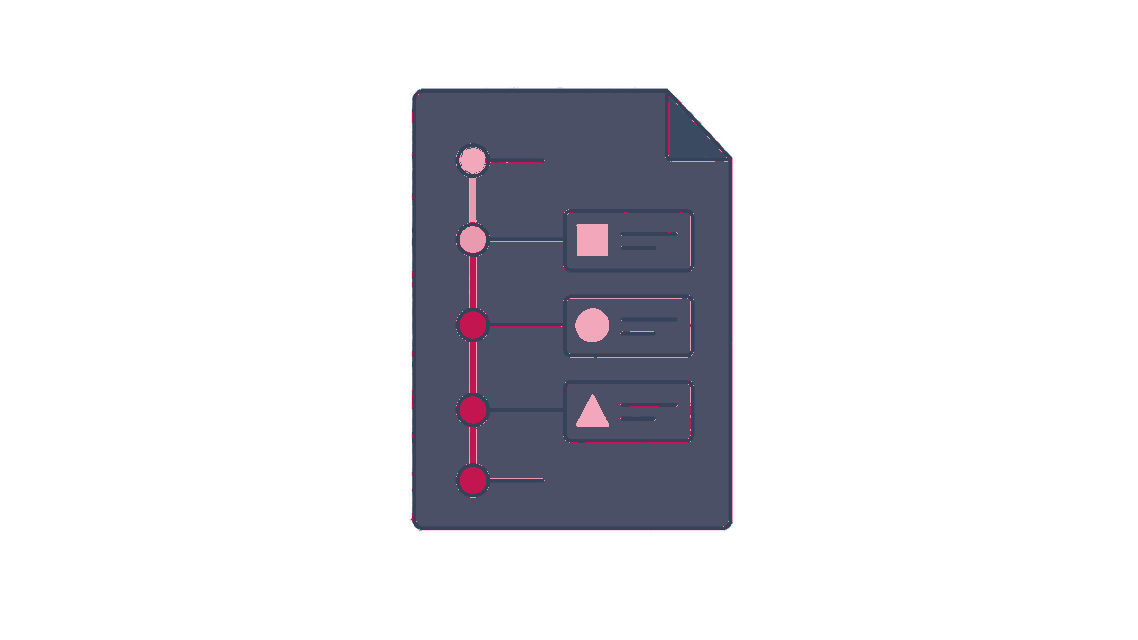
Observed paths through the journey, including backtracking, skipped steps, and re-entry.

Exit-vs-loop classification
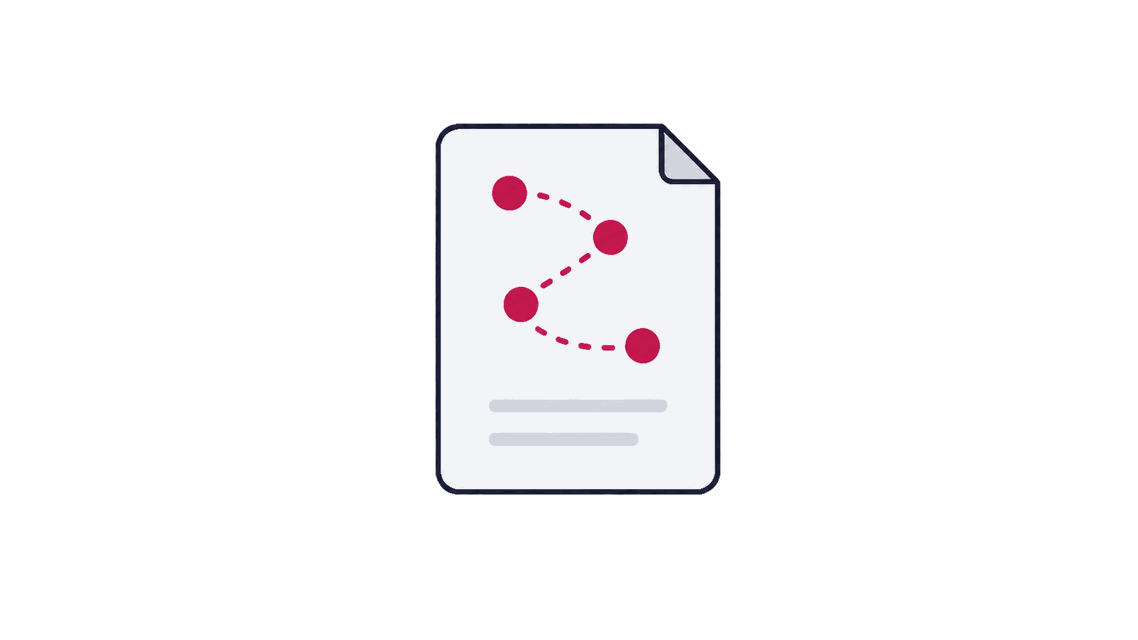
Each step classified by whether its drop-off is mostly true exits, loops that eventually continue, or a mix, with the counts behind the call.
Step-tagged qualitative evidence
Exit-survey, support, and recording evidence tied to the specific step each observation describes.
Journey evidence map with traced causes
The full cross-step map, ordered by opportunity, showing which downstream drops trace to an upstream cause.
Before the work starts
When this work is the right next step
A funnel chart marks the exit while the cause may sit earlier. Friction can begin before the step where someone abandons. An earlier choice may confuse them, or an entry-page promise may fail later in the path. Reading the visible step alone sends the fix to the wrong place.
A good fit when
- Your conversion path crosses several pages or steps, but the funnel report still treats the journey as one straight line.
- Step-to-step analytics data exists, yet backtracking, skipped steps, and re-entry disappear before anyone can map the observed paths people actually take.
- The visible drop sits on one step, while exit surveys or recordings point to confusion that began earlier in the journey.
- Reports review each step in isolation.
- Backtracking and re-entry disappear from the analysis.
- Fixes target the visible drop before the team checks earlier steps.
- Exit surveys and recordings lose their connection to a specific step.
Better handled as other work when
- The whole conversion happens on one page, so a Conversion Research Audit can examine it without a cross-step journey map.
- Sessions cannot be stitched across steps, so a true exit and a later re-entry would look identical in the evidence map.
- The journey has just launched, so no traffic history exists yet to show observed paths, loops, or real exits.
People who own a single channel
Paid Search, Paid Social, CRO, and Programmatic each run under a named owner at Zeo. The consultants below are matched to the channel this page is about, so you can see who you'd actually work with.







Tools we use
Tools behind this work
 Fullstory
maps the real paths people take, not just the one step where a funnel chart marks the exit
 Google Analytics
the step-by-step exploration that separates true exits from people who loop back and continue later
Related work


Parent service
CRO & Experimentation
Separating a true exit from a loop that eventually continues produces a cause, not a plan; CRO decides whether that cause becomes a test, a fix ticket or more research.


Single-page sibling
Conversion Research Audit
The single-page version of this diagnostic, for when the whole conversion happens on one page.


Where traced causes become hypotheses
Experiment Hypothesis Roadmap
The method that takes a traced cause from this diagnostic and turns it into a scored, sequenced hypothesis.
Follow the drop beyond the chart
Trace the problem through the whole journey