











Web Analytics · Marketing Measurement
Marketing Forecasting & Scenario Planning
A range with named drivers behind it plans better than one confident number.
A single-point forecast hides the assumptions carrying the plan. We build a range, show which drivers move it, and model scenarios around the assumptions most likely to shift. You end up with a backtested forecast with a defensible range, named drivers, and scenarios tied to the planning decision.

Some of the 500+ brands we've worked with
See all references















































How we run it
The model must hold up against historical periods withheld from its inputs.
The model shows how its assumptions shape the range instead of presenting one precise-looking answer. Four steps connect the planning question to a forecast range, scenarios, and refresh triggers.
How we hold ourselves to it
- Establish the baseline from real history — We establish the baseline from your historical performance, including known seasonality and past interventions.
- Identify the drivers that matter — We isolate the two or three assumptions, such as spend, conversion rate, or market conditions, that move the forecast most.
- Build named scenarios — We produce a base case with upside and downside scenarios, each tied to specific named assumptions.
- Backtest before you trust it — We test the model against periods with known outcomes to show how it would have performed historically.
Frame the planning question
We agree what decision this forecast needs to support and over what time horizon. Planning owner confirms this is the decision being forecast.
Planning brief

Build and backtest the model
We build the model and backtest it against historical periods before using it for planning. The analyst checks the backtest error against an accepted threshold.
Backtest results


Define scenarios
We identify the key drivers and define named scenarios around plausible ranges for each one. Planning owner confirms the scenario ranges are plausible.
Scenario book


Deliver and set refresh triggers
We present the forecast and agree which changes, such as a platform shift, new competitor, or pricing change, should trigger a refresh. The leadership agrees which triggers force a forecast refresh.
Forecast readout


We build the forecast around named drivers and a plausible range.
Automation frames the planning question from the notes, runs the baseline against periods with known outcomes, drafts upside and downside ranges per driver, and proposes refresh triggers. The judgments belong to your side and ours together: what decision is being forecast, whether the backtest error is acceptable, and which ranges are actually plausible.
What you get
You get a planning range with the assumptions exposed.
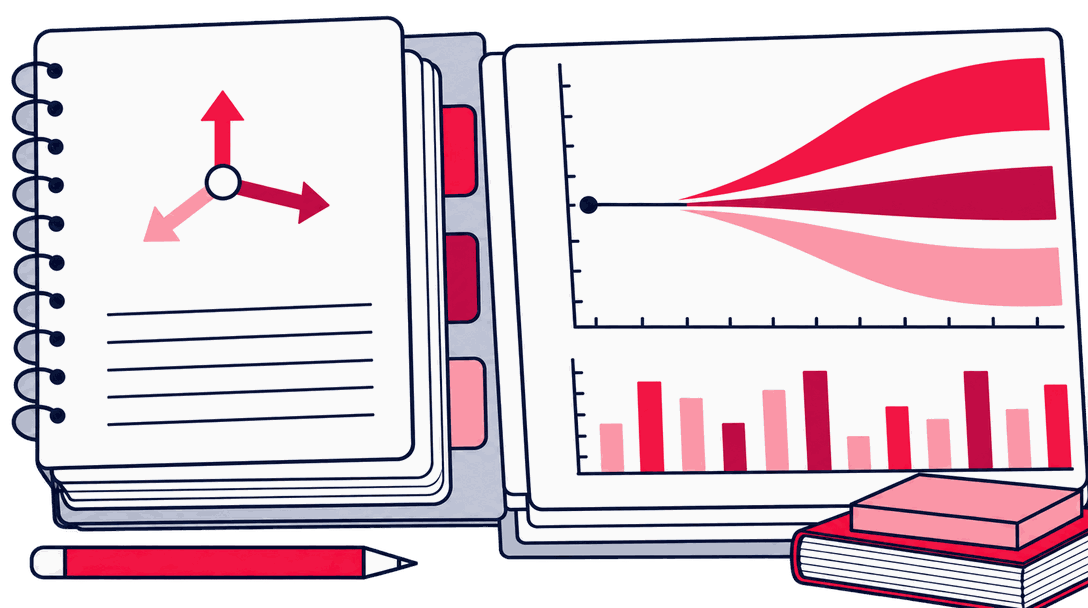
The deliverables show the range, the scenarios behind it, and how the model performed in backtesting.
Working document
Forecast model
The reproducible model and its baseline, documented well enough to update later.
Reference document
Scenario book
Base, upside, and downside scenarios tied to named, specific assumptions.
QA notes
Backtest results
How the model would have performed against periods you already know the outcome for.
We call it done when: the model has been backtested against periods with known outcomes, the scenarios bracket a plausible range, and the refresh triggers are agreed.
Fit and readiness
One confident number can hide every assumption carrying the forecast.
This work fits a defined planning decision backed by enough consistent historical data.
A good fit when
- You need a forecast for a hiring, budget, or inventory decision, and a single-point number does not give you enough to plan around.
- Past forecasts have missed actual results badly enough that leadership no longer trusts a single-point estimate for the next planning decision.
- You want to see how spend level, conversion rate, or seasonality changes the plan through named scenarios.
Better handled as other work when
- You need daily budget pacing and bid management. That responsibility stays with your paid-media team, while this work builds the forecast.
- Your historical data is too broken or inconsistent to support a forecast. A GA4 audit or reporting validation should come first.
If one of these is closer to your situation, start here instead: All Marketing Measurement & Attribution tasks
We call it done when: the planning owner has confirmed the decision the forecast informs, and everyone is using the same planning horizon.
People who build your measurement system
Zeo designs measurement systems that connect a business decision to governed collection and reporting you can check. The people shown here work on the part of that system this page covers.

Zafer Yıldız
Web Analytics Manager

Abdullah Tanıdır
Performance Marketing Team Lead

Sevda Yurtvermez
Performance Marketing Team Lead

İlker Emir
Senior Performance Marketing Executive

İpek Ezer
Performance Marketing Executive

Serap Yurtvermez
Performance Marketing Team Lead

Onur Durdağı
Performance Marketing Executive

Deniz Çağın Demirci
Frontend Developer

Mirzamin Aghazada
UI/UX Designer

Yağmur Bayram
Sr. SEO Analyst

Gülşah Şahin Özkan
Senior SEO Analyst
Tools we use
Tools behind this work
 Jupyter
runs the backtest against withheld history so the model is judged on what it never saw
 Prophet
the forecasting library that outputs a range by default, not a point estimate dressed up as one
 Looker Studio
carries the delivered range and named scenarios past the initial handover, watched for refresh triggers
Where this fits
Keep going

Same capability
Marketing Attribution Modeling
Scenarios that move spend between channels inherit whatever credit rule the baseline was built on, so it is worth testing that split against one alternative first.


Same capability
Incrementality & Lift Measurement
An upside scenario assumes the channel keeps producing conversions at the modeled rate; a controlled holdout is the only evidence that those conversions need the channel.


Elsewhere in analytics
Data Enrichment & Transformation
A backtest only means something if the history behind it stopped moving; dated, versioned transformation rules stop a label change from quietly rewriting last year's baseline.
Next step
Plan with a range and named scenarios


Before we start
Questions teams ask before booking
Why give a range instead of one number?
A single number implies more certainty than any forecast actually has. A range with named drivers tells you what to watch and what would change the picture, which is more useful for planning than false precision.
How often should we refresh the forecast?
We agree on specific triggers upfront, such as a material platform change, a new competitor, or a pricing shift. This is more useful than an arbitrary schedule that may refresh too often or too rarely.
Can you also manage our live budget based on this forecast?
Not in this task. It produces the forecast and scenarios. Day-to-day budget pacing and bid management stay with your paid-media team, which can use the forecast as an input.
How far back does the forecast data need to go?
Historical performance data covering enough time to see seasonality, and clarity on the planning decision this forecast needs to support.